Summary
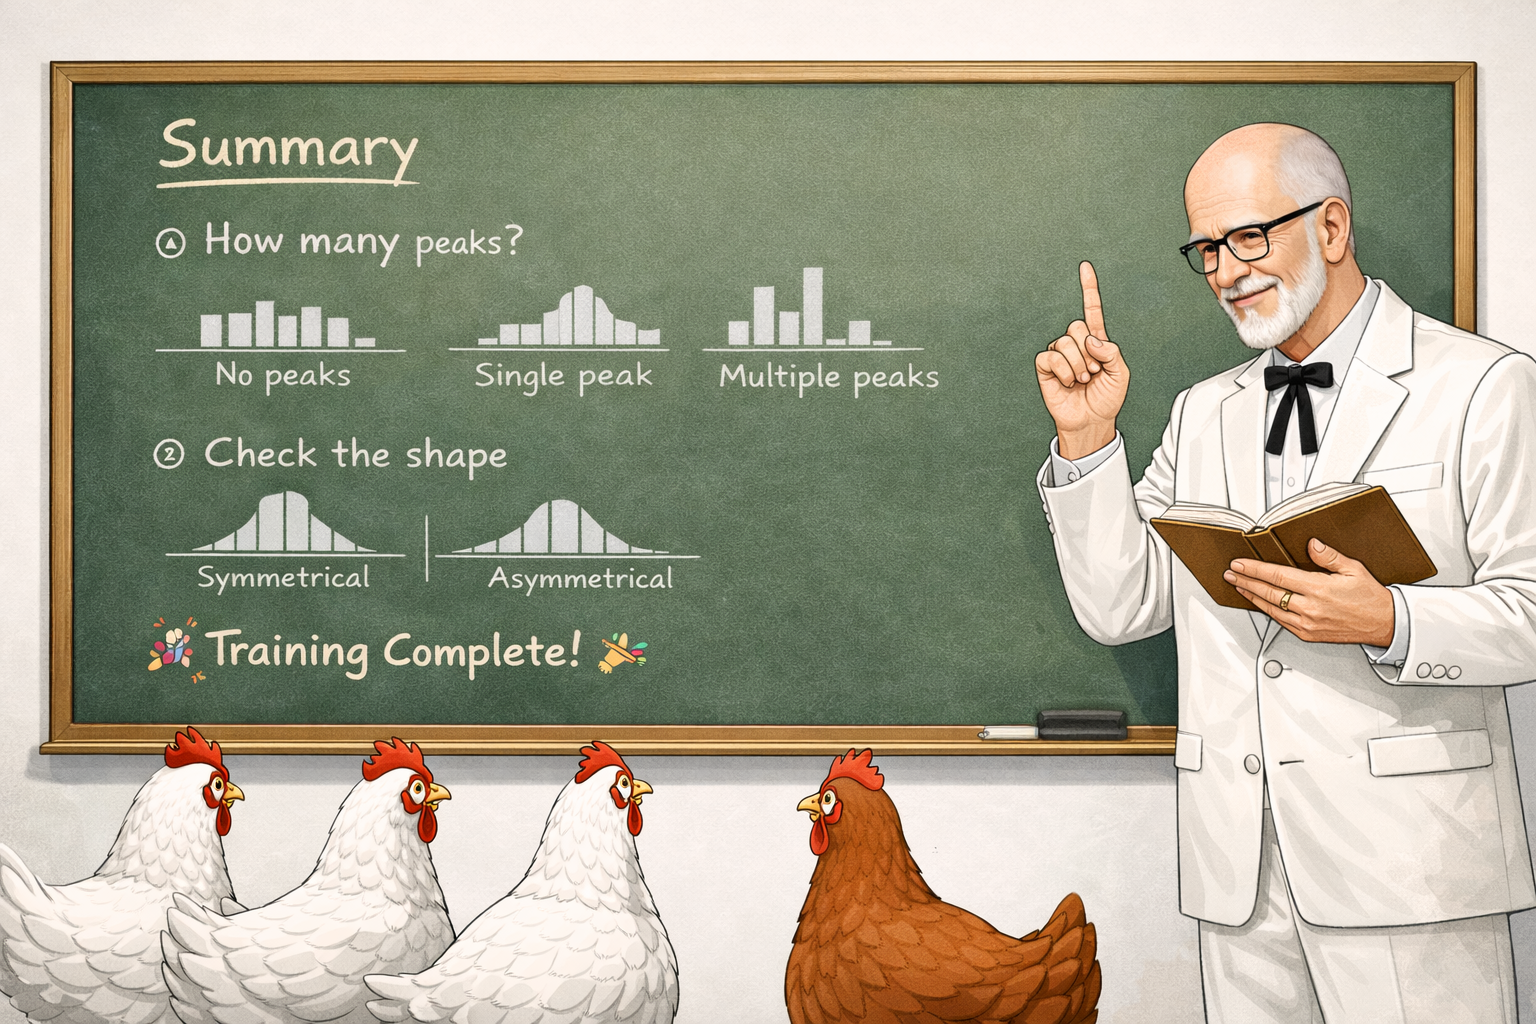
Figure 6. The Colonel shares his wisdom on interpreting frequency distributions.
Well now, let me tell you something. Looking at a frequency distribution is like sizing up your flock. You want to know if there's one main group or several, and whether things are balanced or leaning one way.
After thirty years of raising chickens, I've learned that patterns tell a story. When most of your birds cluster around the same weight, that's a good sign. Your feed's working and your flock is healthy. But when you see two separate groups? That's worth investigating.
Same goes for balance. A nice symmetrical spread means things are running smooth. But if you've got a long tail stretching out one direction, well, that's nature's way of telling you something interesting is going on.
Key steps
-
Look at the overall pattern
Get a sense of where the bars are tallest and how they are arranged.
-
Count the peaks
Are there no clear high points, one main peak, or multiple separate peaks?
-
Check for symmetry (the mirror test)
Imagine a line through the center. Do both sides look roughly like mirror images?
🎯 Remember for peaks:
- • No peaks = all bars roughly equal height
- • Single peak = one clear high region
- • Multiple peaks = two or more distinct highs
🪞 Remember for shape:
- • Symmetrical = both sides mirror each other
- • Asymmetrical = one side has a longer tail
🎉 Training complete!
You are now ready to interpret frequency distributions like a profesional Head Chicken Checker.